Analytics and Dashboarding
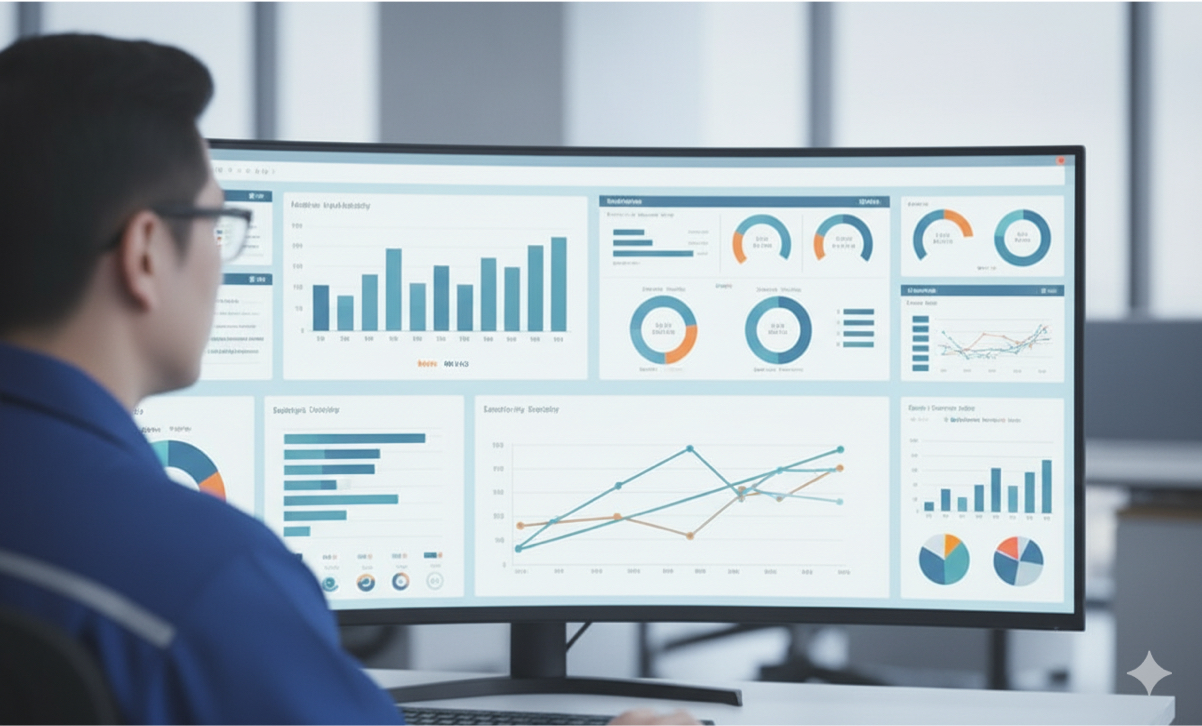
Analytics and dashboarding are about turning raw data into clear decisions. We design data pipelines, KPI models, and visualisations that help stakeholders act faster. Our dashboards focus on clarity, actionability and performance — avoiding clutter while exposing the critical signals.
We implement ETL/ELT, semantic layers, and real-time streaming where required. Visualizations are built with accessibility and interactivity in mind: clear charts, drill-downs, filters and annotation capabilities so teams can explore and trust their data.
Outcomes typically include faster decision cycles, improved operational visibility, and measurable improvements in the KPIs you care about — from throughput and yield to sales conversion and customer retention.
Why Choose Analytics & Dashboarding
-
Data-first design: aligning metrics to business outcomes and decision workflows.
-
Robust data pipeline and modelling expertise for accurate KPIs and lineage.
-
Real-time and historical views, alerts and automated reporting options.
-
User-centric visualisations with accessibility and mobile responsiveness.
-
Integration with source systems, BI platforms and ML models for advanced analytics.
-
Governance, security and role-based access to protect sensitive data.
-
Actionable dashboards that reduce time-to-insight and improve operational control.


